
Azure Ultra Disk Storage is here
Application Development Manager Omer Amin provides guidance for optimizing solutions that leverage the recently released Azure Ultra Disk Storage.
With the recent GA announcement of Azure Ultra Disk Storage, customers now have access to Managed Disks for extremely high performance and mission critical workloads. Customers can provision disks up to 300 IOPS per GiB, to a maximum of 160,000 IOPS per disk. With increased IOPS and throughput, it’s important for architects to understand Azure’s throttling limits to ensure they design systems optimally.
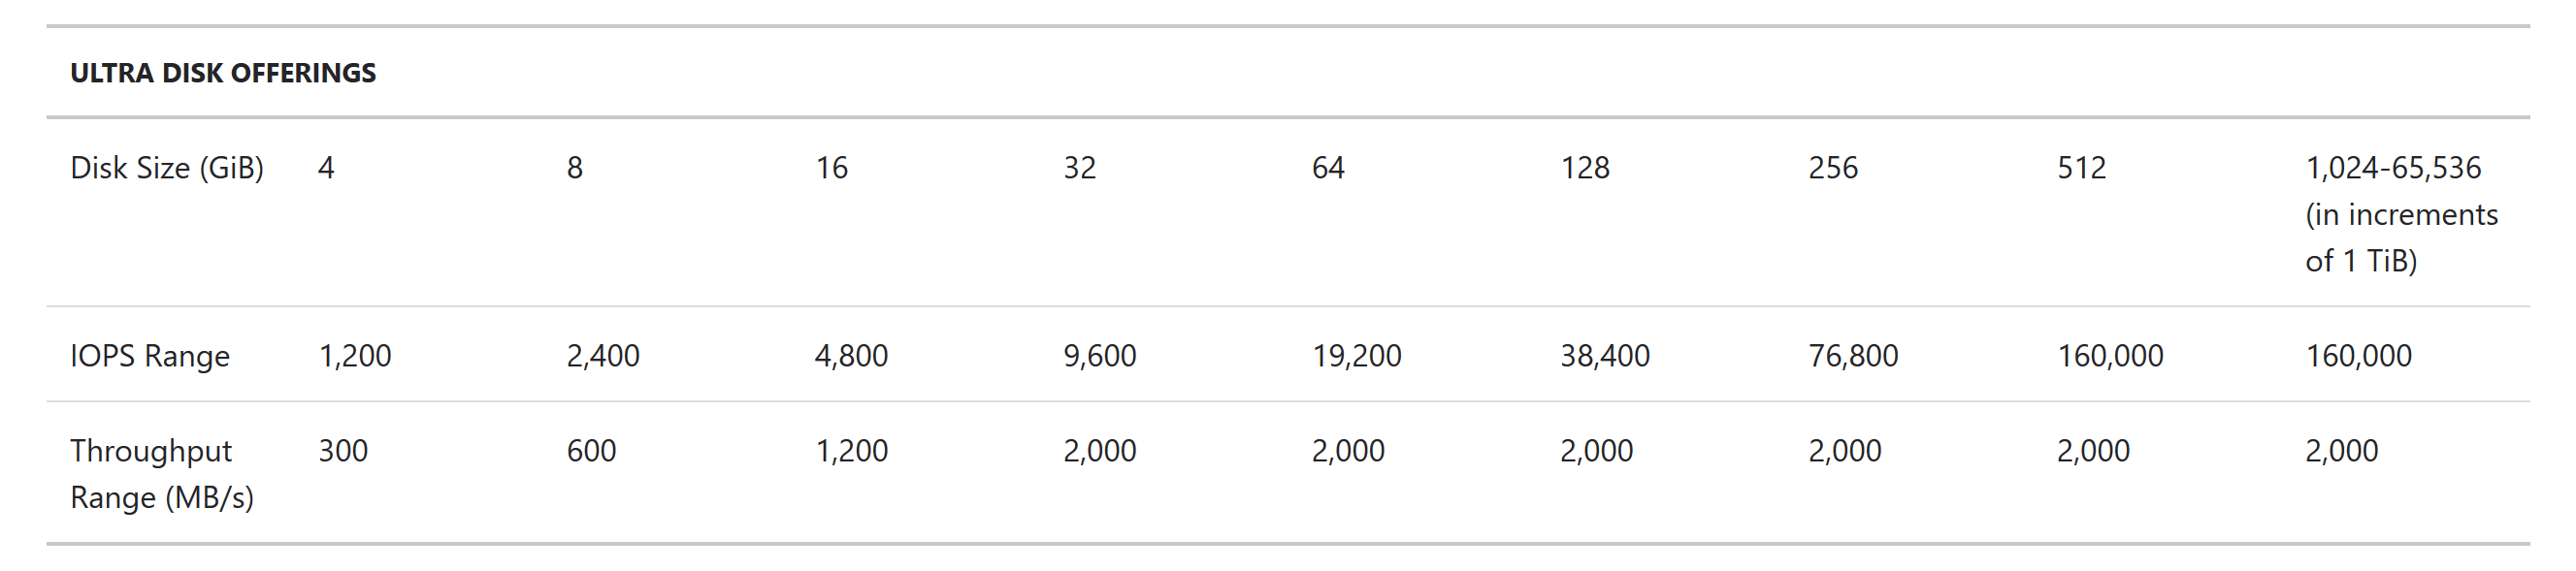
For instance, attaching a 16 GiB Ultra Disk equates to 4,800 IOPS. However, if that disk is attached to a Standard_D2s_v3 virtual machine, it will get throttled to 3,200 IOPS due to the virtual machine’s IOPS limit. To take advantage of an Ultra Disk, we need to make sure that it gets attached to a virtual machine having sufficient IOPS and Mbps throughput.
Azure applies 2 kinds of throttling limits at the resource level: virtual machine level throttling, and disk level throttling. Throttling can kick in when workloads go over either the IOPS limit or the throughput cap on the individual resource.
So how do you monitor for throttling? Azure does not export specific counters that state when a resource gets throttled. However, you can configure the performance counters and compare them against the published limits shown above. These counters can be collected and pushed to a Log Analytics workspace. Once the data is in Log Analytics, you can query it using PowerShell to find out if resources were throttled.
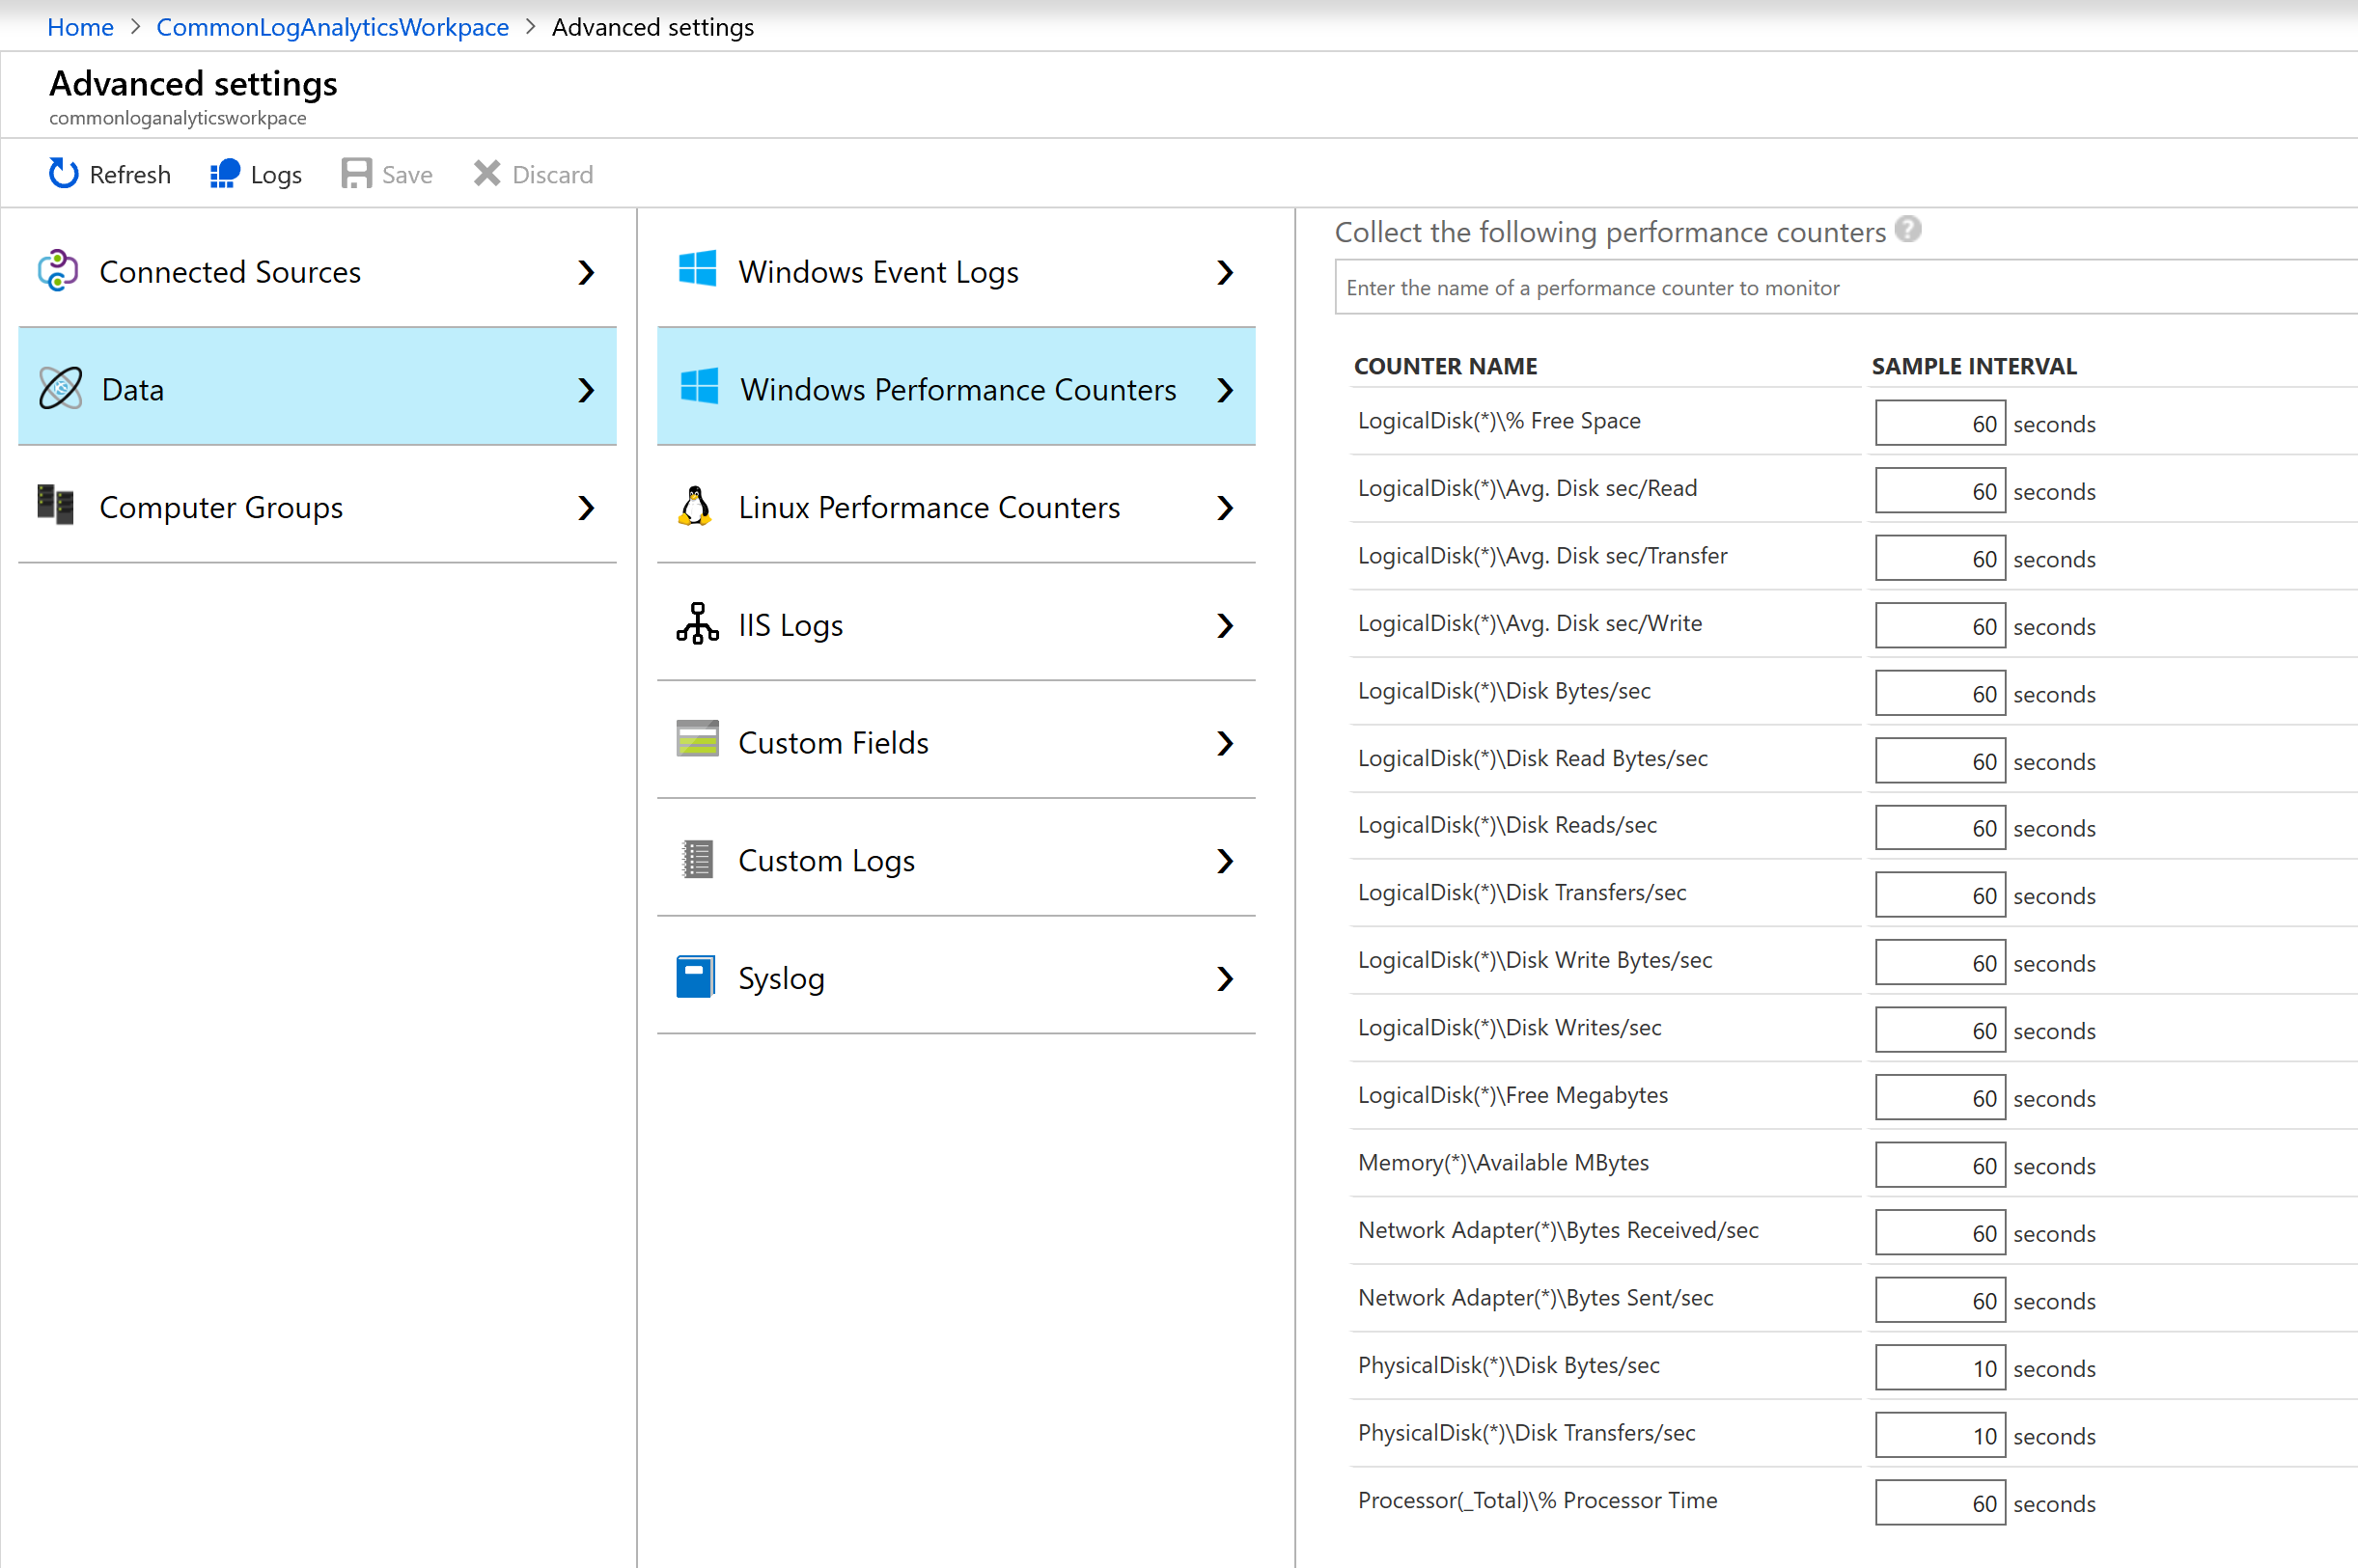
To push logs to a workspace, you can configure from the screen below.

Once the logs are published, you need to configure specific performance counters to be collected. In our case, to measuring throttling, we need to collect the Physical Disk(*)\Disk Bytes/sec and Physical Disk(*)\Disk Transfers/sec. The minimum collection window is 10 seconds. Once performance counter collection is configured, data will start showing up in the Log Analytics workspace in approximately 20-30 minutes.
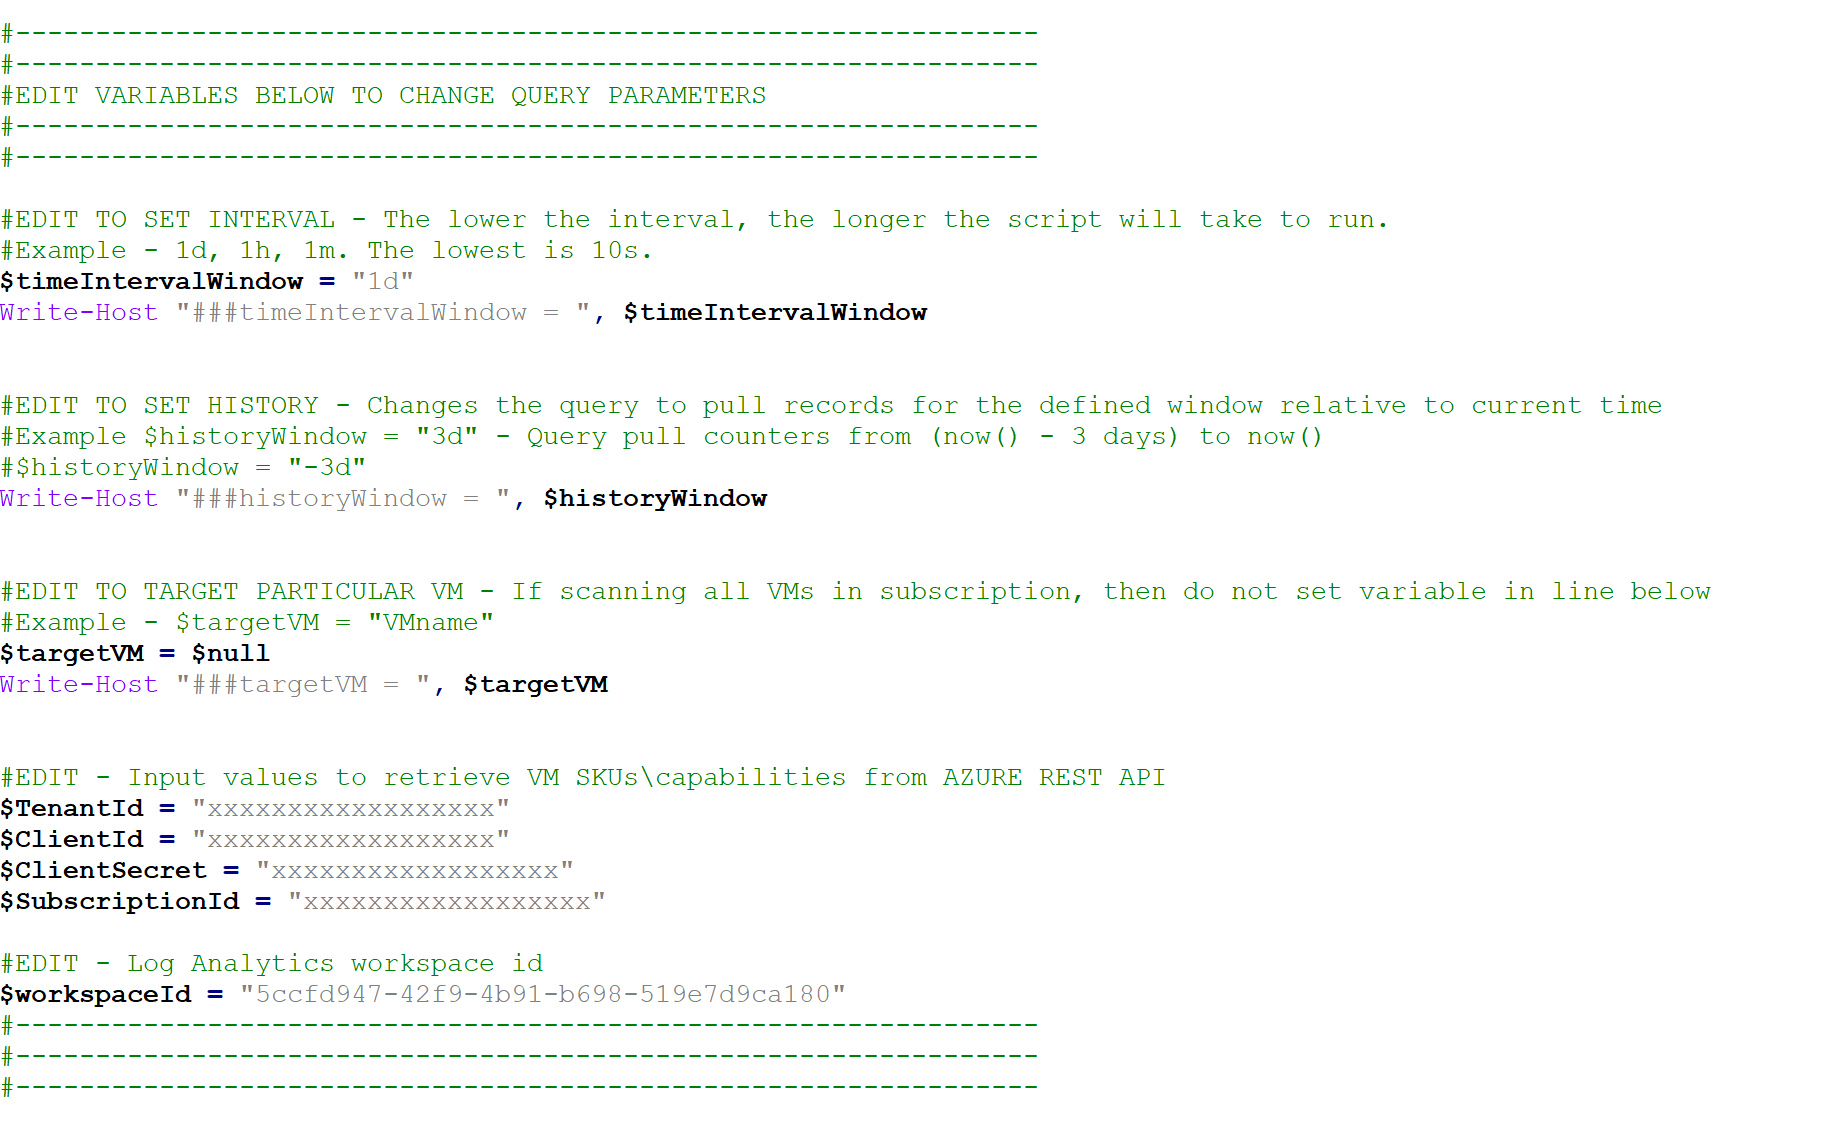
I published this script on GitHub, which gets the published limits from the Azure REST API, and then queries the log analytics workspace for each VM/disk to see if it was above the throttle limits.
Once you download the script, you will need the Log Analytics workspace ID. You will also need to create an identity for an Azure AD application. This will allow PowerShell to run Azure REST APIs and get the published data. You will need the Tenant ID, Subscription ID, Client ID, and Client Secret to run the script. Once you have downloaded the script, update the values in the following section to match your environment.
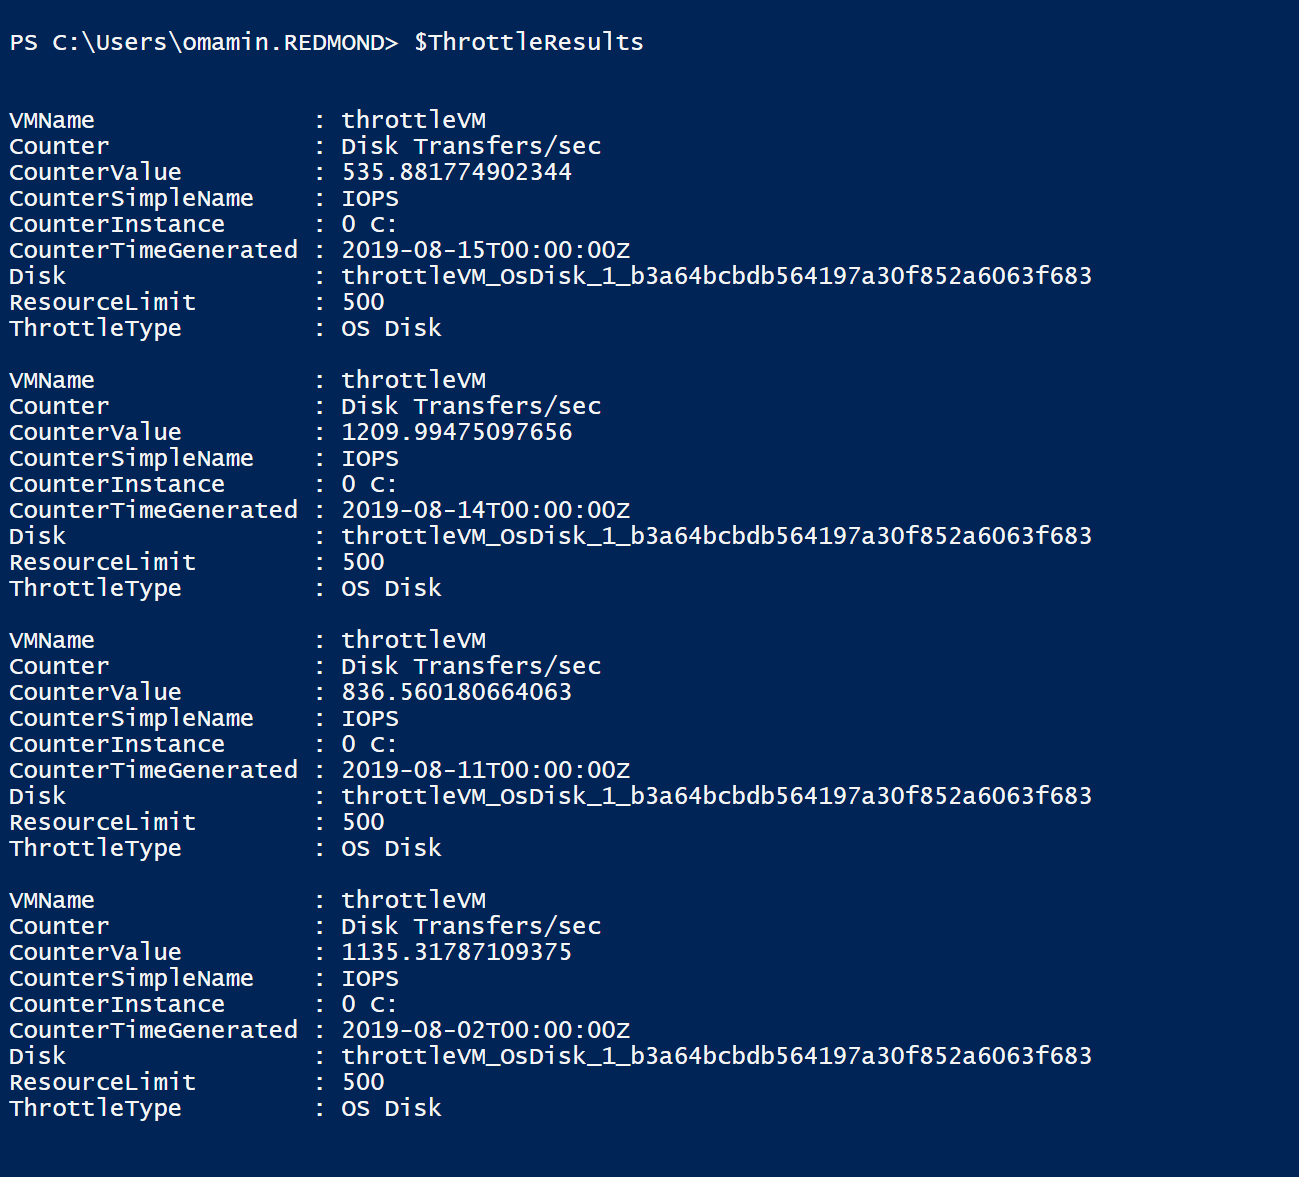
Once you run the script, it will return an array of objects throttled.
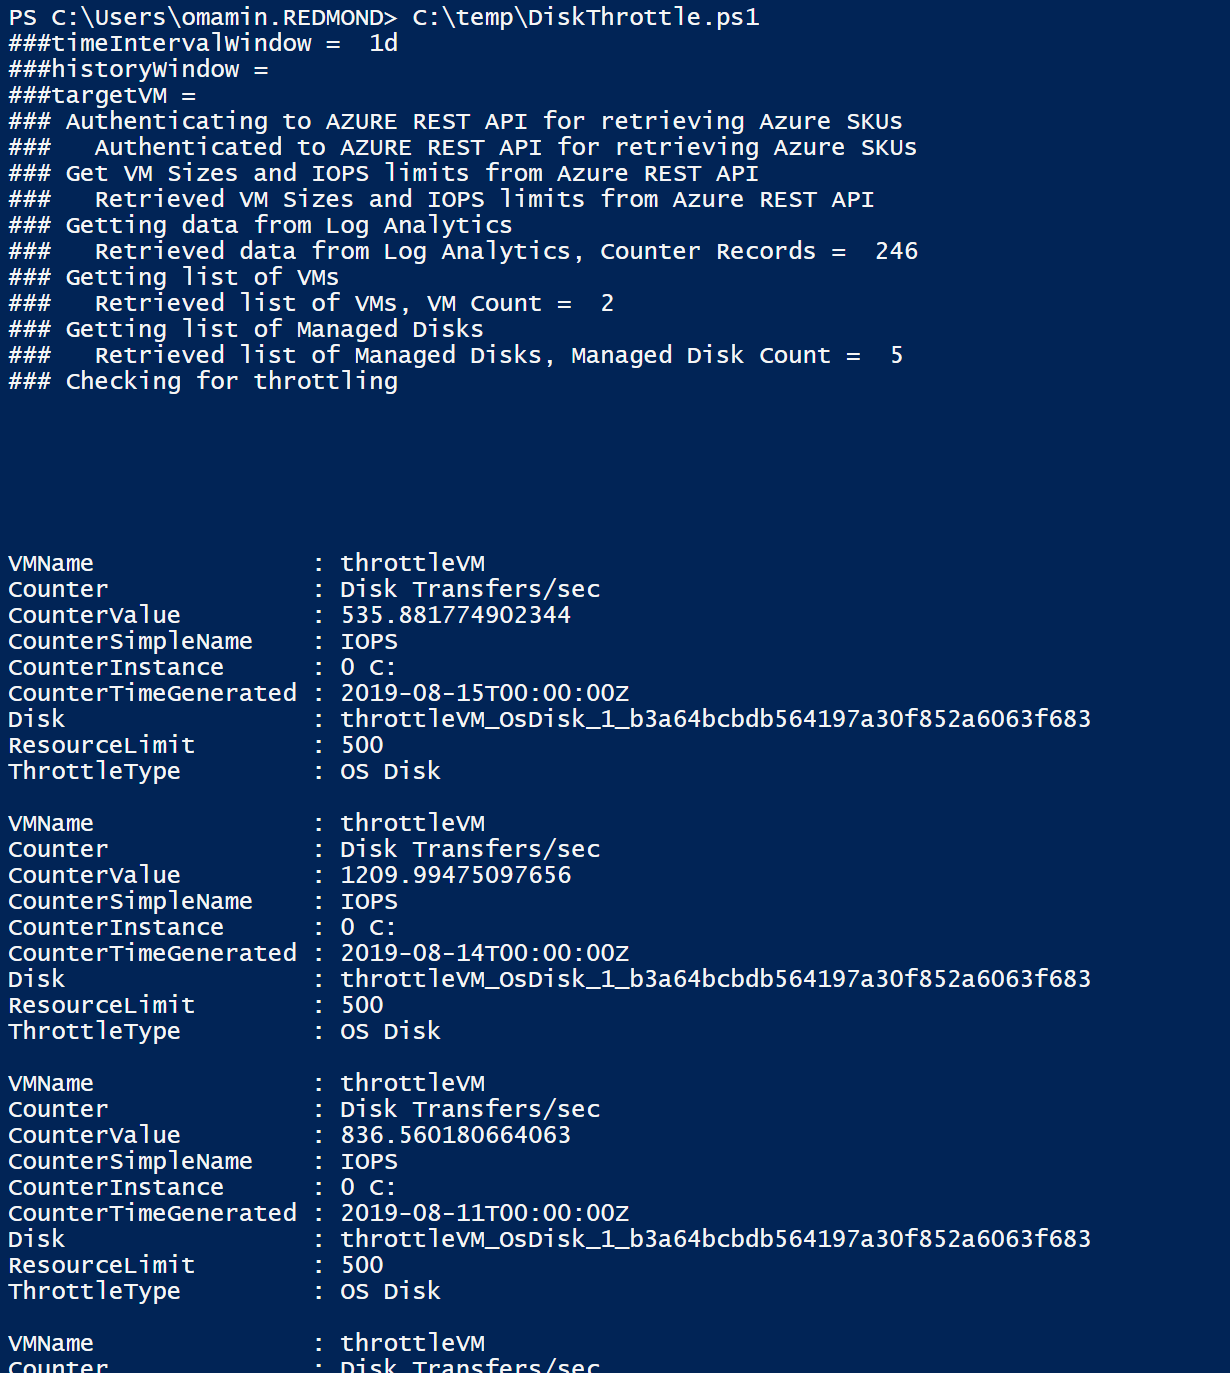
You can also review the results by printing $ThrottleResults at the console. The output below shows the details of each throttling event.
Note – Performance counters from virtual machines are collected at 10 second intervals. Therefore, if there are any short bursts of disk activities, it might not get caught captured.
 Light
Light Dark
Dark
0 comments