Is innovation another loss due to the global COVID-19 pandemic? Indicators reveal challenges to overcome—as well as opportunities to build on our collective experience gained in the last year. Measuring collaboration using network machine learning provides a powerful diagnostic tool to address issues as they arise. One challenge lies in how we build relationships in the workplace. With many transitioning to work-from-home environments, more flexible schedules, and new methods of working, there is evidence that interactions at work have been impacted in multifaceted ways.
- Report Work Trend Index
This year’s Work Trend Index shows that the world’s information workers have begun a fundamental transition into a new world of work. According to the report, over 70 percent of global workers surveyed want flexible, remote work options to continue. At the same time, over 65 percent say they want more in-person time with teams. This future is dependent on utilizing new technologies for communication and collaboration, meeting the needs of individuals when it comes to motivation and mental health, and evolving ideas to accommodate modern workplaces—big and small.
As the world over the past year has changed in the wake of COVID-19, employees’ networks have narrowed. It’s important that we find ways to rebuild our wider work networks as we adjust to new ways of collaborating with others. Innovative teams have been shown to frequently have access to novel information from across their organization and to create new collaborations on a regular basis. Workers will need to tap into a diversity of ideas and viewpoints to foster creativity. The bottom line is that social ties and support networks are important to both our productivity and our ability to adapt at work. You can learn more about some of the takeaways for business leaders and workplaces in this Harvard Business Review article (opens in new tab).
Microsoft Research Podcast

AI Frontiers: AI for health and the future of research with Peter Lee
Peter Lee, head of Microsoft Research, and Ashley Llorens, AI scientist and engineer, discuss the future of AI research and the potential for GPT-4 as a medical copilot.
Within Microsoft Research, we are developing network machine learning to derive insights from connected data. In the case of the Work Trend Index, this technique can be applied to understand global patterns across Microsoft 365. Our Graph AI efforts have led us to develop tools and techniques to use connected data to service a wide variety of research application areas, such as tech fraud in the Microsoft Digital Crimes Unit, search in Microsoft Bing, and others. The graspologic open-source Python package, developed jointly with Johns Hopkins University performs partitioning, visual layouts, and network embeddings based on our research methods. Recently, we’ve been making advances in applying network machine learning to inform new solutions across Microsoft 365 and Microsoft Viva. In order to advance both theoretical research in Graph AI and applied research in organizational science, we have formed collaborations with research organizations, including Johns Hopkins University Department of Applied Mathematics and Statistics and the Michael G. Foster School of Business at the University of Washington.
By using AI to understand the connection between employees, teams, and organizations, our research enables a deeper understanding of how the workplace has changed over the last year, in particular how the interactions across and within groups of information workers have been impacted. Using network partitioning, visual mappings of organizational networks, and graph metrics, we seek to gain insights into workplace communication trends within Microsoft 365.
Using network machine learning to measure collaboration changes through COVID-19
Executives want to understand how they can better support the evolving communication and collaboration needs of their employees using data-driven, privacy-protected analyses. Microsoft 365 gives us a lens into the patterns of employee collaboration. For this study, we analyzed a subset of email interactions and meeting interactions in Microsoft Teams and Outlook. This aggregated data removes personal or organization-identifying information, such as company name. At Microsoft, we take privacy seriously. Learn more about our approach.
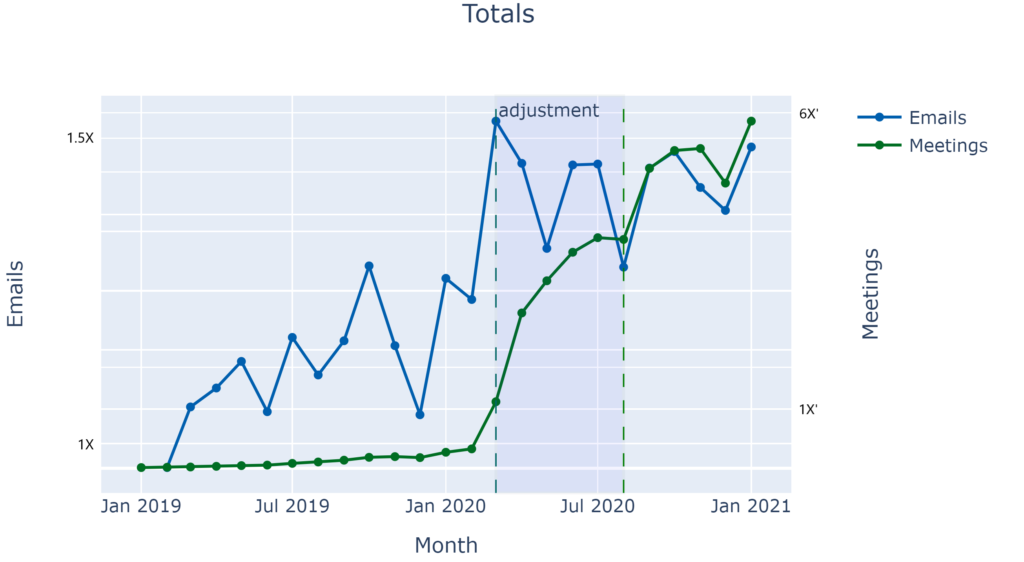
As much of the world shifted to work from home in response to COVID-19, we immediately saw a massive increase in Teams meetings and a modest increase in email volume (see Figure 1 below). Both these increases persist as we cross the one-year mark. As we explore more of the trends in these findings, it’s worth keeping in mind that this was not a typical year for information workers and workplaces. Many people did not elect to work remotely, were working in less-than-ideal work spaces, and were attempting to balance work with personal obligations, like childcare.
In a communication graph, we identify workgroups based on collaboration patterns to understand the relationships between elements of an organization. While these workgroups frequently overlap with the official organizational chart, they instead represent the informal connections through which work actually gets done.
We use hierarchical Leiden clustering, implemented in graspologic, to automatically identify workgroups based on their communication patterns. Leiden clustering, a recent method for finding clusters in networks, was chosen due to its speed, when working with large amounts of data, and its performance improvements over previous methods. We’ve used learnings from prior visualization research to construct a network map that represents the organization.
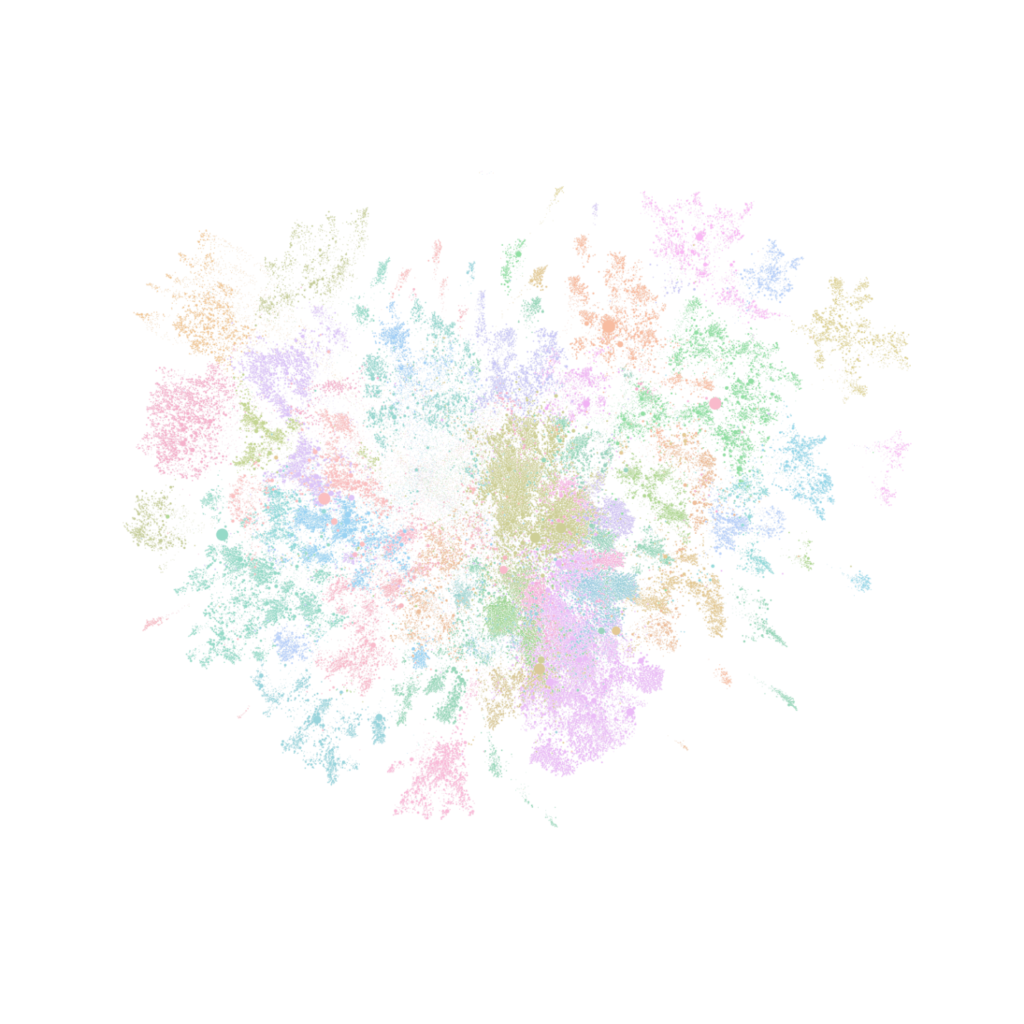
The layout was automatically generated with graspologic. We use a generalized node2vec embedding, UMAP for dimensionality reduction to 2D space, and finally an occlusion removal algorithm. The colors were calculated using network machine learning and represent workgroups that communicate more with each other than with the rest of the company. Once we have identified the workgroups and generated a layout, we calculate analytics at the workgroup and organization levels to preserve employee privacy while providing executives with actionability.
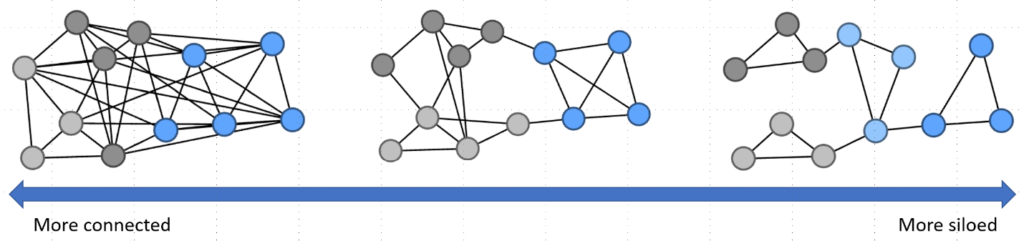
Words to know: Workgroup siloing. Workgroup siloing, also known as modularity, helps us identify if a network is more connected or more siloed and provides a score to rate how siloed the network is. The higher this score, the more segmented the group of nodes are—as seen in the figure.
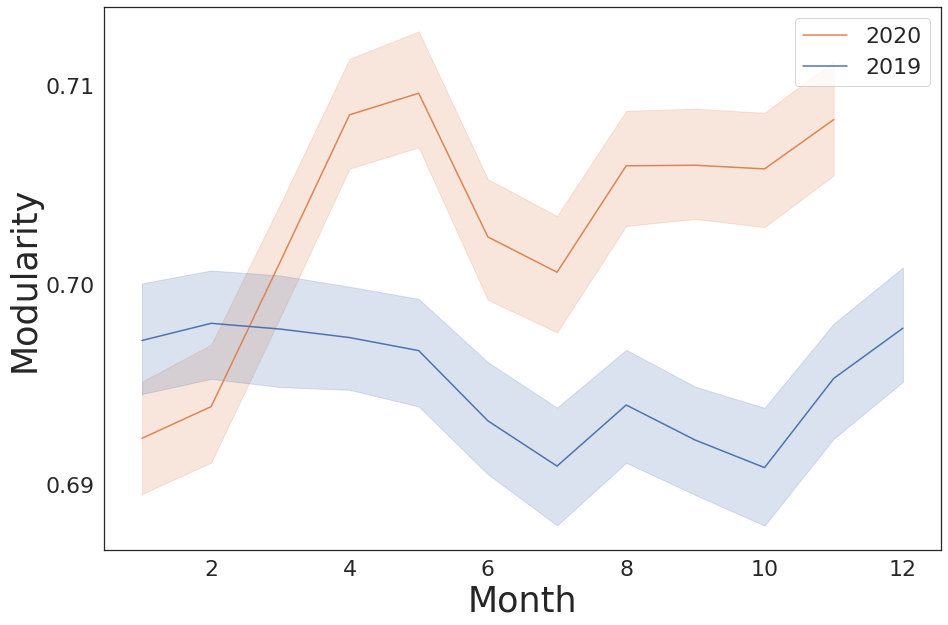
From April 2019 to April 2020, modularity, a measure of workgroup siloing, rose around the world. As more people moved to remote work, there was a tendency to communicate more among familiar people and less across workgroups. The year over year increase in modularity was found to be statistically significant. This small overall change still indicates a sizable impact on individual workgroups and organizations.
Using modularity as a measure of workgroup siloing, we can look at a set of organizations to observe a large increase in modularity around the time work-from-home orders were being issued worldwide. We are currently researching the increasing modularity to help leaders understand how to respond in light of these significant changes.
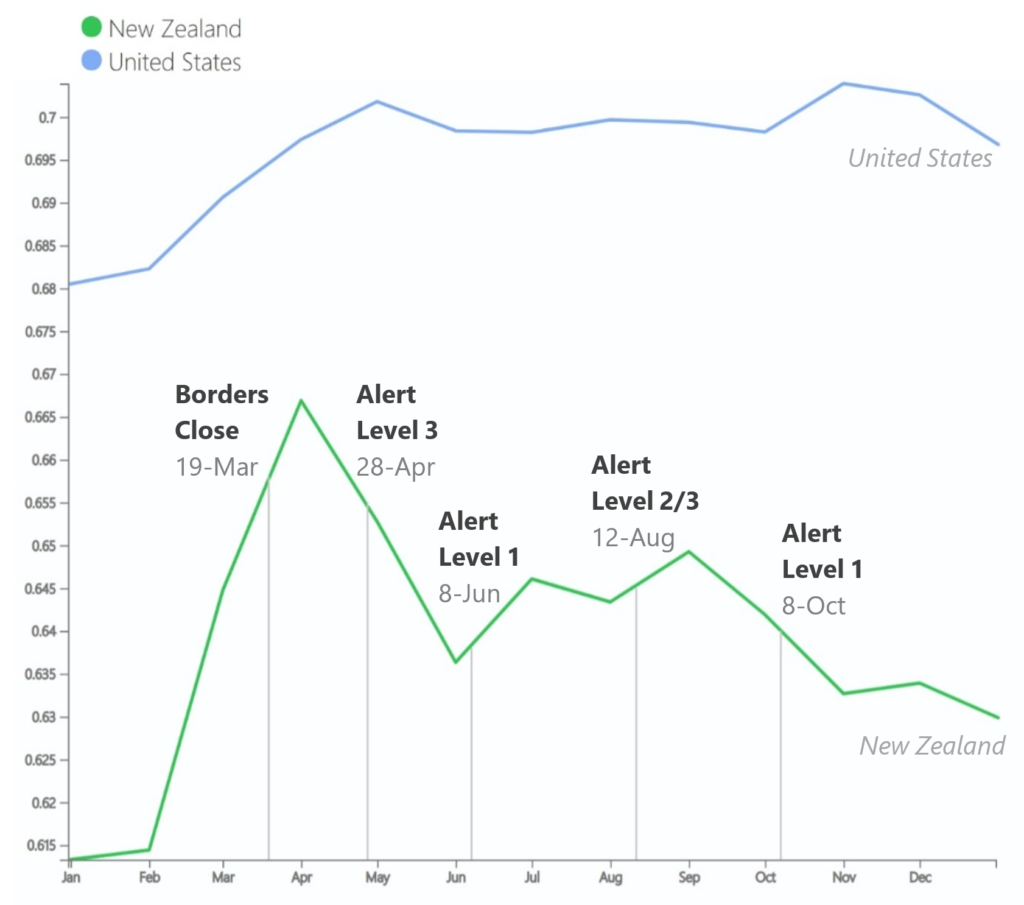
A comparison of workplace siloing in the United States and New Zealand
This increased workgroup siloing has persisted into 2021. We consider the United States and New Zealand to understand the effect of society reopening on modularity. United States information workers have not yet returned to the office on a large scale, while New Zealand has eased restrictions several times. Modularity remains elevated in the United States; in New Zealand, after October’s move to Alert Level 1 (see Figure 4), we see modularity gradually decrease. When lockdowns are relaxed, we see that teams become more connected. This trend is also observed in other countries. Of some concern, however, New Zealand has yet to return to pre-pandemic levels of modularity, indicating a persistent effect to date.
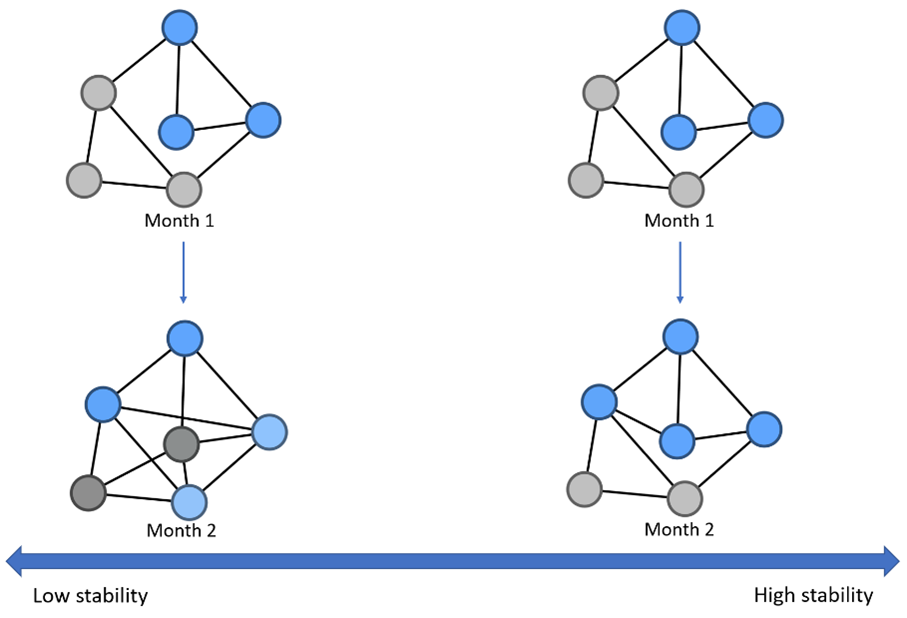
Words to know: Workgroup stability. Workgroup stability measures the change in workgroups from month to month. Specifically, it calculates the similarity between two sets of data clusters using the adjusted rand index. The clusters are the workgroups of employees, calculated using machine learning and denoted by color in the image. A higher workgroup stability score means that communication patterns are more stable and more like the prior month.
Workgroup stability, which measures the change in workgroup membership over time, varies by the type of communication being used. Email, a more formal method of communication, declines in workgroup stability immediately after COVID-19 becomes widespread. Stability remains below 2019 throughout the adjustment period. After this period of adjustment, we see email stability return to 2019 levels. The more informal communication medium of Teams meetings saw a sudden rise in stabilization over the adjustment period continuing into 2021.
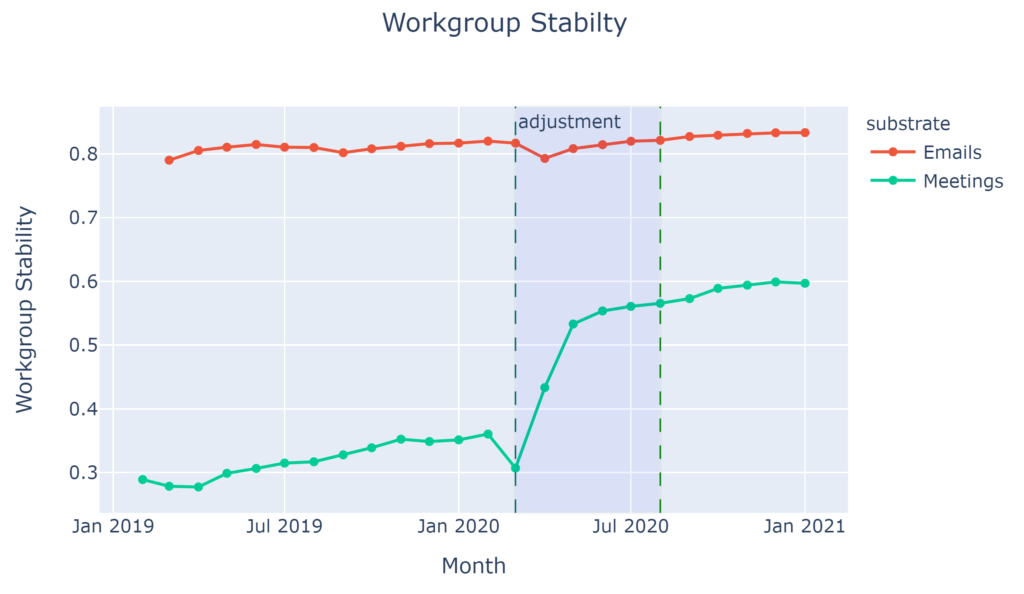
We see a large increase in Microsoft Teams usage beginning in March, as organizations adapted to many employees working from home. This increase in meeting workgroup stability likely is the effect of regular workplace interactions moving to Teams. Rather than an occasional way to connect, Teams has become a necessary tool for daily interaction with work colleagues.
Circling back, the findings in the Work Trend Index reveal there are some positive takeaways from the solidifying of existing connections. For example, 39 percent of people surveyed said that they feel like they “are more likely to be their full, authentic selves at work.” There were co-workers meeting one another’s families or pets for the first time virtually and other signs that people were leaning on their close colleagues for support. You can learn more about those findings in the Work Trend Index.
Instilling an innovation mentality and deepening inter-team collaboration going forward
As we look ahead to a return to the workplace, whether that means a hybrid or full return, organizations and their employees will be able to take advantage of in-person opportunities to build community. In an interview with Harvard Business Review, Dr. Nancy Baym, Senior Principal Researcher at Microsoft, recommends making space for informal employee connections. “These types of interactions are critical to a thriving workplace—for employees and organizations. They spur spontaneous and one-off conversations, especially with people outside our immediate team, expand our knowledge and can energize our thinking.”
Microsoft Researchers and collaborators are conducting further studies and are committed to using findings like these to create new solutions as we navigate the changes unfolding in the workplace, resulting in a shift in how businesses and individuals perceive and accomplish work goals. Check out the The New Future of Work project page to explore some of the ways researchers have been developing new methods for collaboration, productivity, and optimization of tools for communication.
Returning to our original question of the state of innovation, new ideas are often correlated with access to novel information. We observed that the workgroup siloing score for both Teams and emails rose around the time work-from-home orders were issued. Workgroups became more siloed, which could lead to higher efficiency and productivity. However, this is also likely at the expense of discovering new ideas that can lead to innovative thinking. This could also mean that inter-team communications aren’t as strong now as they were before. Since March, meetings became more stable, while email did not. Meeting stability increased as daily workplace interaction shifted online. We continue to investigate these metrics.
The shifts in the last year to predominantly looking inward will make it more difficult to discover the new ideas that lead to innovation. In the past, these connections were facilitated by watercooler chats and hallway conversations. As we slowly emerge from the COVID-19 pandemic and into a new world of hybrid work, organizations will need to intentionally create opportunities for expanded connections that empower workgroups to cultivate innovation.
A note on privacy
Microsoft takes privacy seriously. We remove all personal and organization-identifying information, such as company name, from our data before analyzing it and creating reports. We never use customer content—such as information within an email, chat, document, or meeting—to produce reports. Our goal is to discover and share broad workplace trends that are anonymized by aggregating the data broadly from those trillions of signals that make up the Microsoft Graph (opens in new tab).