- Home
- Artificial Intelligence and Machine Learning
- AI - Machine Learning Blog
- Debug Object Detection Models with the Responsible AI Dashboard
- Subscribe to RSS Feed
- Mark as New
- Mark as Read
- Bookmark
- Subscribe
- Printer Friendly Page
- Report Inappropriate Content
At Microsoft Build 2023, we announced support for text and image data in the Azure Machine Learning responsible AI dashboard in preview. This blog will focus on the dashboard’s new vision insights capabilities, supporting debugging capabilities for object detection models. We’ll dive into a text-based scenario in a future post. In the meantime, you can watch our Build breakout session for a demo of a text-based scenario and other announcements supporting responsible AI applications.
Introduction
Today, object detection is used to power various critical and sensitive use cases (e.g., face detection, wildlife detection, medical image analysis, retail shelf analysis). Object detection locates and identifies the class of multiple objects in an image, where an object is defined with a bounding box. This is distinguished from image classification, which classifies what is contained in an image, and instance segmentation, which identifies the shapes of different objects in an image.
Missed object detections across subgroups of data can cause unintended harms – reducing reliability, safety, fairness, and trust in machine learning (ML) systems. For example, an image content moderation tool might have high accuracy overall but may still fail to operate well in certain lighting conditions or incorrectly censors out certain ethnic groups. These failures often remain hidden, as most ML teams today only rely on aggregate performance metrics that do not illustrate individual features. ML teams also lack visibility into black box model behaviors that lead to varied error distributions. These challenges prevent ML teams from optimizing for quality of service by mitigating model discrepancies, considering fairness in selecting the best model, and ensuring that models that are updated/re-deployed due to availabilities of new ML advancements or new data do not introduce new harms.
The road to addressing these issues is often tedious and time consuming, as ML teams must navigate fragmented debugging tools, create custom infrastructure, or manually slice and dice through data. Evaluation results are difficult to compare and share to get input and buy-in from both technical and non-technical stakeholders. Yet combining technical expertise with ethical, legal, economic and/or social considerations is key to holistically assess and safely deploy models.
To accelerate responsible development of object detection models, this blog will dive into how to holistically assess and debug models with the Azure Machine Learning responsible AI dashboard for object detection. Leveraging active data exploration and model interpretability techniques, this dashboard helps ML practitioners identify fairness errors in their models and data, diagnose why those issues are happening, and inform appropriate mitigations.
The responsible AI dashboard for object detection is available via the Azure Machine Learning studio, Python SDK v2, and CLI v2 and already supports tabular and language models. The dashboard is also integrated within the Responsible AI Toolbox repository, providing a greater suite of tools to empower ML practitioners and the open-source community to develop and monitor AI more responsibly. For other computer vision scenarios, you can learn from these technical docs to generate and analyze responsible AI insights for image classification and image multi-class classification.
In this deep dive, we will explore how ML practitioners can use the responsible AI dashboard for evaluating object detection models by identifying and diagnosing errors in an object detection model’s predictions on the MS COCO dataset. To do this, we will learn how to create cohorts of data to investigate discrepancies in model performance, diagnose errors during data exploration, and derive insights from model interpretability tools.
Prerequisites for dashboard setup
This tutorial builds on previous blog posts to set up responsible AI components in Azure Machine Learning. Please complete the prior steps below:
- Login or Signup for a FREE Azure account
- Part 1: Getting started with Azure Machine Learning Responsible AI components
- Part 2: How to train a machine learning model to be analyzed for issues with Responsible AI
- NOTE: We’ll be using MS COCO dataset for this tutorial.
- This tutorial requires the Azure Machine Learning responsible AI dashboard’s Vision Insights component. Learn how to get started with this component and technical requirements (e.g., model and data format) in the technical documentation.
- Example notebooks related to non-AutoML and AutoML supported object detection tasks can be found in azureml-examples repository.
1. Identifying errors with Model Overview
As a starting point for your analysis, the Model Overview component in the responsible AI dashboard provides a comprehensive set of performance metrics for evaluating your object detection model across dataset cohorts or feature cohorts. This allows for error exploration to identify cohorts of data with a higher error rate compared to the overall benchmark, or under/overrepresentation in your dataset.
In this component, you can investigate your model by creating new cohorts based on investigation concerns or observed patterns and compare model performance for those cohorts. To illustrate with an example case study with MSCOCO data, we may be interested in evaluating our object detection model’s performance when detecting a person in an image, particularly in analyzing the impact of co-occurrence with other classes. In detecting a person, how much does our model rely on the object’s pixels versus deducing from the pixels of co-occurring object classes in the same image?
To start, we can create cohorts to compare the performance of images with people co-occurring with various objects. These dataset cohorts can be created in the Data Explorer component, which we will cover in the following section.
- Cohort #1: Images of people + either skis or skateboards
- Cohort #2: Images of people + either bats or tennis rackets
In the Dataset cohorts pane, the metrics table displays the sample size of each dataset cohort and value of selected performance metrics for object detection models. Metrics are aggregated based on the selected method: Mean Average Precision (mAP) for the entire cohort, as well as Average Precision (AP) and Average Recall (AR) for the selected object class. The metrics visualization also provides a visual comparison for performance metrics across dataset cohorts.
Figure 1: To evaluate how Average Precision and Average Recall for detecting a person class compares in “the skis or surfboards” cohorts versus the “bats or tennis rackets” cohort, as well as the overall performance across all images, we select the “person” class from the dropdown menu.
To evaluate confidence in your object detection model’s predictions, you can set the IoU threshold value (Intersection of Union between the ground truth and prediction bounding box) that defines error and affects calculation of model performance metrics. For example, setting an IoU of greater than 70% means that a prediction with greater than 70% overlap with ground truth is True. Typically, increasing the IoU threshold will cause the mAP, AP, and AR to drop. This feature is disabled by default, and can be enabled by connecting to a compute resource.
Figure 2: Interestingly here, the Average Precision and Average Recall of the person class in the “Skis and surfboards” cohort did not drop when the IoU threshold was increased from 70% to 80%. This shows that our model detects the “person” class in images where a person co-occurs with skis and surfboards with better fidelity, compared to the cohort with people and baseball bats or tennis rackets.
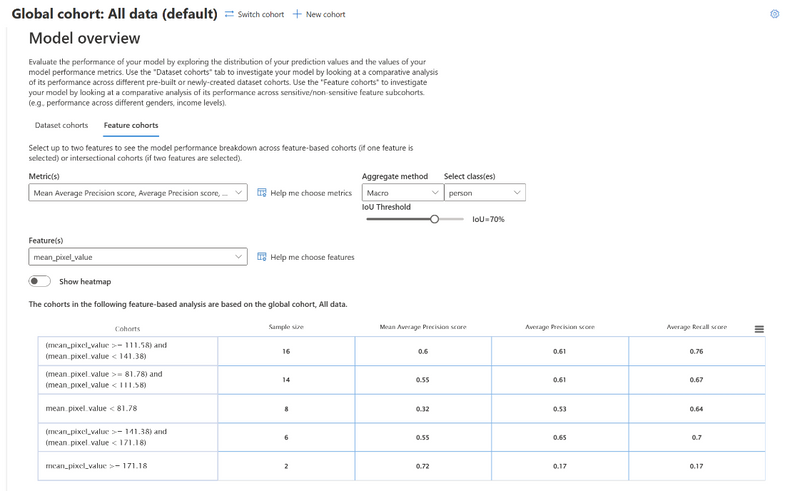
Another lens to evaluate your model’s performance is using sensitive and non-sensitive feature-based cohorts. This allows you to identify fairness issues, such as higher error rates for a certain genders, ethnicities, or skin colors when detecting a person in an image. In the Feature cohorts pane, you can automatically create a default amount of three cohorts and split them according to values of your specified feature.
Figure 3: We created three separate cohorts based on an image’s mean pixel value and compared the model’s performance in detecting a person across cohorts. Here, images with a mean pixel value of higher than 151.31 have a lower average precision score when compared to other cohorts.
Next, let’s select “Help me choose features” next to the Feature(s) drop-down. Here, you can adjust which features to use to evaluate your model’s fairness, as well as determine the number of feature splits for performance comparisons.
Figure 4: Under “Help me choose features,” we adjusted the number of cohorts from the default of three cohorts to five cohorts.
Greater granularity of feature splits can enable more precise identification of erroneous cohorts. In the next section, we can visually inspect the contents of each cohort in the Data Explorer.
Figure 5: Here, we observe that lower average precision scores for images with a mean pixel value of higher than 151.31 (concluded from the previous split of three cohorts) can be attributed to lower performance for images with a mean pixel value of greater than 171.18, instead of images with the mean pixel value range of 151-171.
2. Diagnosing errors
Debugging the data with Data Explorer
After identifying dataset and feature cohorts with higher error rates with Model Overview, we’ll use the Data Explorer component for further debugging and exploration of those cohorts through various lenses: visually in an image grid, in tabular form with metadata, by the set of classes present in ground truth data, and by zooming into individual images. Beyond statistics, observing prediction instances can lead to identifying issues related to missing features or label noise. In the MS COCO dataset, observations in Data Explorer help identify inconsistencies in class-level performance despite having similar object characteristics (e.g., skateboards vs. surfboards and skis) and initiate deeper investigation on contributing factors.
Visually inspect error and success instances in an image grid
With the Image explorer pane, you can explore object bounding boxes in image instances for your model’s predictions, automatically categorized into correct and incorrectly labeled predictions. This view helps to quickly identify high-level patterns of error in your data and select which instances to investigate more deeply.
Figure 6: Based on previous observations of model performance across feature cohorts, we may be interested in visually analyzing image instances where the mean pixel value is one-half less than the maximum value. Here we create a new cohort with that feature criteria and filter image instances displayed by that criterion.
Aside from metadata feature values, it’s also possible to filter your dataset by index and classification outcome, as well as stack multiple filters. As a result, we can view success and error instances from all image instances corresponding to our filtering criteria.
Figure 7: After filtering and new cohort creation, this view shows success and error instances for all images where the mean pixel value is one-half less than the maximum value.
Explore predictions in tabular form and segment data into cohorts for comparison
In addition to visual exploration, the Table view pane allows developers to skim through your model’s predictions in tabular form – identifying ground truth, predicted class labels, and metadata features for each image instance.
Figure 8: For each image instance, you can view the image index, True Y labels, Predicted Y labels, and metadata columns in a table view.
This view also offers a more granular method to create dataset cohorts – you can manually select each image row to include in a new cohort for further exploration. To group images of people with skis and snowboards that we used at the start of our analysis, we can select images with a person and either ski or snowboard labels in the True Y column. We can name this cohort “People on Skis or Surfboards” and save it for analysis throughout all dashboard components.
Figure 9: Here, we manually select each image instance with a person and either ski or snowboard labels in the True Y column to save these images as a new cohort.
Since the dashboard shows all data by default, we can filter to our newly created cohort to see its contents.
.
Figure 10: After filtering to a new cohort of “People on Skis or Surfboards”, we see that there are 6 successful predictions for people on skis or surfboards in our dataset.
Diagnose fairness issues in class-level error patterns
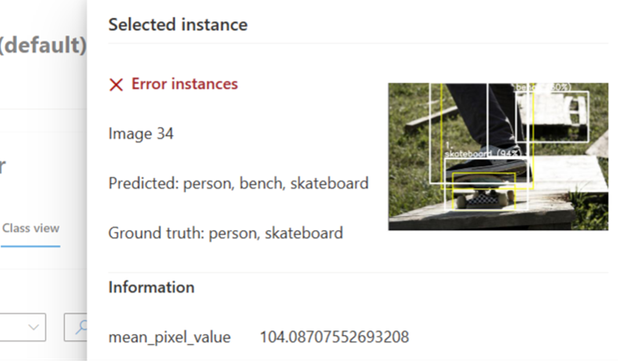
To diagnose fairness issues present in error patterns per class, the Class view pane breaks down your model predictions by selected class labels. Here, error instances are where the predicted set of classe labels do not exactly match the set of class labels in ground truth data. This may call for investigation on individual instances to identify underlying patterns in model behavior, leading to potential mitigation strategies that we will explore at the end of this walkthrough.
Figure 12: By selecting images where a person is detected alongside a skateboard, skis or a surfboard, we can see that from this dataset of 44 total images, there are 3 images with a person and skis or a surfboard – all successful instances where the person and ski/surfboard object are detected correctly. However, the image with a person and skateboard is an error instance, which we can inspect further.
Discover error root causes through detailed visual analysis of individual images
Since bounding boxes on image cards might not be enough to diagnose causes behind specific error instances, you can click on each image card to access a flyout to view detailed information, such as predicted and ground truth class labels, image metadata, and visual explanations for model interpretability. To further diagnose model behavior in making erroneous predictions, we can look into explanations for each object in an image – which will be covered in the following section.
Figure 13: Looking into the error instance of the image with a person and skateboard, it’s revealed that the person and skateboard was correctly detected, but a bench was also detected when it is not within the set of ground truth class labels (person, skateboard). We can diagnose causes for this with model interpretability.
Debugging the model with explainability insights
Model interpretability insights provide clarity around model behavior leading to the detection of a certain object. This helps ML professionals explain the expected impact and potential biases of their object detection models to stakeholders of all technical backgrounds. In the responsible AI dashboard, you can view visual explanations, powered by Vision Explanation Methods, Microsoft Research’s open-source package that implements D-RISE (Detector Randomized Input Sampling for Explanations).
D-RISE is a model-agnostic method for creating visual explanations for the predictions of object detection models. By accounting for both the localization and categorization aspects of object detection, D-RISE can produce saliency maps that highlight parts of an image that contribute most to the prediction of the detector. Unlike gradient-based methods, D-RISE is more general and does not need access to the inner workings of the object detector; it only requires access to the inputs and outputs of the model. The method can be applied to one-stage detectors (e.g. YOLOv3), two-stage detectors (e.g. Faster-RCNN), as well as Vision Transformers (e.g. DETR, OWL-ViT). As there is value to model-based interpretability methods as well, Microsoft will continue to work and collaborate on extending the set of available methods for interpretability.
D-Rise provides a saliency map by creating random masks of the input image and will send it to the object detector with the random masks of the input image. By assessing the change of the object detector’s score, it will aggregate all the detections with each mask and produce a final saliency map.
Interpreting D-RISE saliency maps for various success and error scenarios
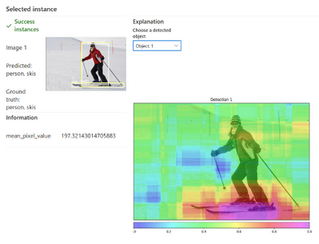
In the responsible AI dashboard, D-RISE powered saliency maps are available on flyouts for selected image instances in Data Explorer. For each object detected in an image, view its corresponding visual explanation by selecting the object from the drop-down (the object number corresponds to the sequence of class labels). The following examples will show how saliency maps provide valuable insight into understanding model behavior behind correct object detection, potential biases due to co-occurrence of objects, and misdetections.
To investigate the detection of a person in the following images, look for the more intense warm colors like red and magenta. These are key to interpretation, as they indicate that most high saliency pixels are focused on the person as would be expected in detecting the person class. This also shows that objects around the person don’t contribute to the prediction as significantly as the person itself.
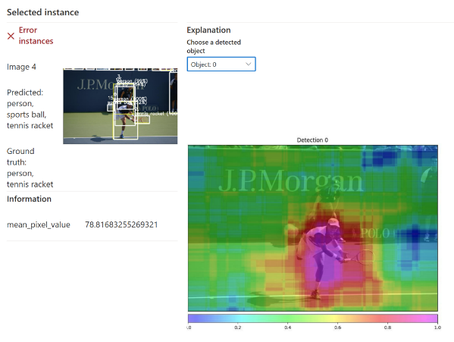
Figure 14: For person on skis, note that there are no high saliency pixels towards most of the skis, and for the person playing tennis, intensely colored pixels are geared towards the person and part of the racket, but the most intensely colored (magenta) pixels focus on the person rather than the tennis racket. You see a reverse notion when looking at the saliency map for the tennis racket in Figure 15 (right-most image), where the most salient magenta pixels are concentrated around the racket rather than the person.
For the same images, other objects alongside the person were correctly detected, such as the skis, tennis racket, or surfboard. However, saliency pixels may reveal confounding factors due to co-occurrence of various objects in those images, leading to bias in those correct predictions.
Figure 15: Notice that there are saliency pixels honing in on the person’s legs in detecting the skis, saliency towards the water in detecting the surfboard, and on the person in detecting the tennis racket. This may imply that the co-occurrence of various objects could form a bias in predictions.
Imagine if there was an image of a pair of skis on the wall; would the skis still be successfully detected without a person? If there was an image of a surfboard without a person or water, would the surfboard still be successfully detected? What other spurious patterns emerge with other classes? You can read more about this scenario and mitigation strategies in “Finding and Fixing Spurious Patterns with Explanations” by Microsoft Research.

Figure 16: For this image of a pair of skis on the wall, an object detection model incorrectly identifies a surfboard as the top detection. The D-Rise saliency map for the surfboard prediction shows that most salient pixels were on only one of the skis and did not focus on the whole object – hence, the incorrect prediction.
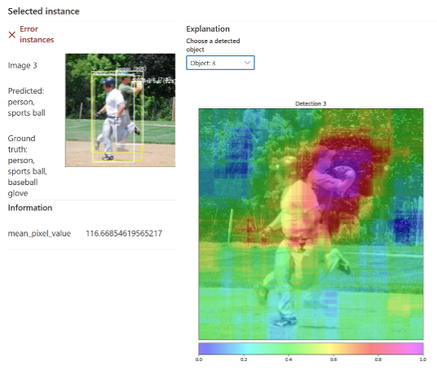
D-RISE saliency maps also provide insight into misdetections, where co-occurrence and positioning of various objects may be contributing factors. This encourages mitigations to improve training data, such as including images with diverse object locations and co-occurrences with other objects.
Figure 17: Here, the model fails to detect the baseball glove, in addition to person and sports ball classes. Looking at the saliency map for the detection of the baseball glove (object 3), high saliency pixels are focused on the ball, which may lead to misdetection as a sports ball, instead of a baseball glove given the proximity of both objects to each other.
Translating model interpretability insights into mitigation strategies
Visual explanations can reveal patterns in model predictions that may raise fairness concerns, such as if class predictions were biased based on gender or skin color attributes (e.g., cooking utensils associated with women or computers with men). This can inform mitigations (e.g. data annotation, improving data collection practices) to prevent object detection models from learning spurious correlations between objects that may reflect biases. Relating to the previous example, the model’s inability to detect skis without a person present suggests that the model will benefit from more images with only skis and no people present in the training data. Insights related to object misdetections also encourage mitigations to improve training data, such as including images with diverse object locations and co-occurrences with other objects.
Conclusion
As we’ve seen from using the Azure Machine Learning responsible AI dashboard for object detection on our object detection model’s predictions on MSCOCO, the dashboard provides various valuable tools to aid ML professionals with error investigation, in the following ways:
- Leverage Model Overview to compare model performance across dataset and feature cohorts
- Dive into error patterns in Data Explorer to investigate potential fairness issues such as the impact of object co-occurrence on class predictions
- Uncover biases in model behavior through D-RISE saliency maps for model interpretability.
With these insights, users are equipped to execute well-informed mitigations to minimize societal stereotypes/biases in visual datasets (images, annotations, metadata) that can unintentionally influence object detection models. Users can also share their findings with stakeholders to lead model audit processes and build trust. Computer vision is well-integrated into our daily lives, but there is much to do for machine learning developers to ensure that deployed models are transparent, fair, accountable, inclusive, and safe for all – and the responsible AI dashboard for object detection is a valuable first step in that direction.
Our Team
The Responsible AI dashboard for object detection is a product of collaboration between Microsoft Research, AI Platform, and MAIDAP (Microsoft AI Development Acceleration Program).
Besmira Nushi and Jimmy Hall from Microsoft Research has been leading research investigations on new techniques to gain in-depth understanding and explanation of ML failures, in collaboration with AI Platform’s RAI tooling team. The RAI tooling team consists of Ilya Matiach, Wenxin Wei, Jingya Chen, Ke Xu, Tong Yu, Lan Tang, Steve Sweetman, and Mehrnoosh Sameki. They are passionate about democratizing Responsible AI and have several years of experience in shipping such tools for the community that are also open source as part of the Azure Machine Learning ecosystem, with previous examples on FairLearn, InterpretML Dashboard etc. Productionizing the RAI dashboard for object detection scenario has also been driven by a team at MAIDAP, consisting of Jacqueline Maureen, Natalie Isak, Kabir Walia, CJ Barberan, and Advitya Gemawat. MAIDAP is a rotational program for recent university graduates, developing various machine learning features at scale in collaboration with various teams across Microsoft.
You must be a registered user to add a comment. If you've already registered, sign in. Otherwise, register and sign in.


